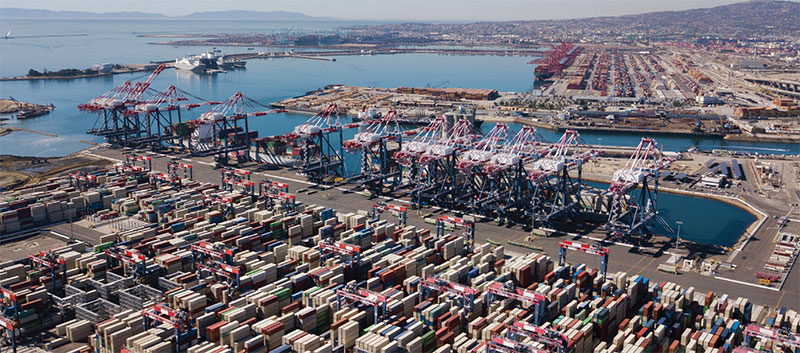
Top 30 U.S. Ports: Big ports got bigger in 2020
The U.S. container seaport sector endured a series of disruptions caused by the pandemic, but still ended up handling more containers than ever. Meanwhile, the temporary blockage of the Suez Canal complicated an ongoing congestion crisis.

The rapid re-emergence of China from initial lockdowns combined with a surge in consumer durables demand and transport of medical supplies in the final quarter of last year meant total inbound handling at Top 30 U.S. ports reached 2.93 million twenty-foot equivalent units (TEU), up by 1.7% year over year according to data from global trade intelligence firm Panjiva.
The largest ports also experienced the fastest growth, with imports to Newark/New York and Long Beach up by 8.1% and 8% respectively year-over-year in 2020. Meanwhile, Savannah and Houston saw volumes increase by 3.4% and 2.2% through a mixture of investment in new facilities and successfully managing heavy weather conditions.
However, not all ports shared in the bounty, as imports to Seattle and Tacoma trended down by 3.4% and 2.8% respectively, while the smaller southern ports of New Orleans and Jacksonville fell by 16% and 10.1% respectively.
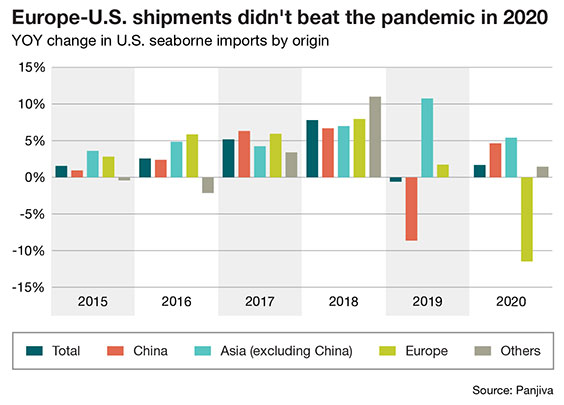
According to Chris Rogers, Panjiva research director, U.S. container seaports endured a series of disruptions caused by the pandemic in 2020, but ended the year with a record level of volumes handled. Much of the growth was thanks to the rapid reemergence of Chinese ports from the pandemic, with shipments that rose by 4.7% year-over-year as a whole, while the previously fast growing “supplier” nations in Asia climbed 5.5% higher.
“Yet, imports from Europe fell by 11.5%, delivering their worst year in terms of TEUs since 2016, as economies there struggled to recover,” notes Rogers. “The global trade economy passed through three phases as a result of the pandemic.”
Early closures of the Asian economies resulted in a 5.2% year-over-year drop in imports in the first quarter of 2020, with even healthcare imports down by 3.6% as countries engaged in medical protectionism. However, the biggest contributor to the drop was a 10.3% slide in imports of consumer discretionary products as Asian factories closed.
A further downturn occurred during the second quarter of 2020, as most economies in the world experienced commercial and industrial closures due to widespread shelter-in-place orders, with U.S. seaborne imports down by 11.1% year over year. An 18% slide in consumer discretionary products, including autos, and an 11.0% drop in materials during that time showed the economic weakness across the consumer and industrial segments.
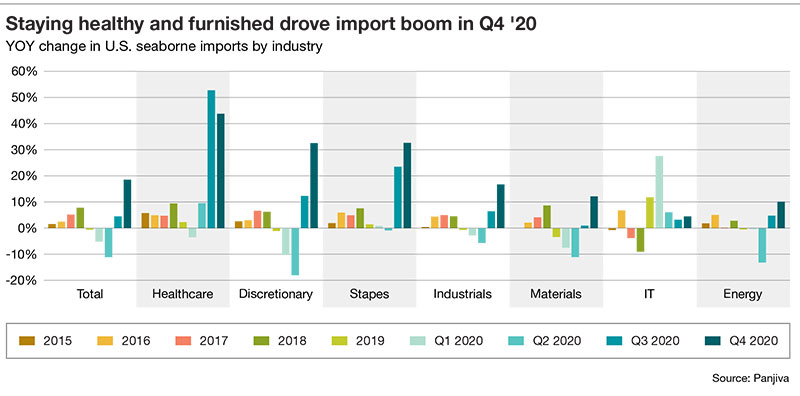
A more disciplined approach to capacity management by global ocean carriers than that shown in the 2016 dip ensured the major liners were able to continue business as normal. “The reopening of economies led to a surge in shipments in the third quarter of 2020 which accelerated to an 18.6% jump in the final quarter of last year with healthcare, consumer durables and staples—including home and personal care goods—all accelerating,” maintains Rogers.
The ports struggled, however, to keep up with congestion starting on the U.S. West Coast and spreading from there as the container lines raced to accept deliveries, but then had to wait for delivery slots as port managers sought to keep up with equipment shortages and the overriding need to keep staff safe and healthy.
Top 30 U.S. Ports
|
Import TEUs | 2020 | 2019 | |||||
2020 Rank | Port | TEUs | % of Total | % of Change | 5-year CAGR | TEUs | Rank |
1 | 4,999,403 | 17.1% | 2.6% | 2.7% | 4,872,493 | 1 | |
2 | 4,599,961 | 15.7% | 8.1% | 5.7% | 4,256,509 | 2 | |
3 | 4,288,103 | 14.7% | 8.0% | 2.1% | 3,971,701 | 3 | |
4 | 2,430,789 | 8.3% | 3.4% | 7.3% | 2,350,410 | 4 | |
5 | 1,995,734 | 6.8% | 2.2% | 6.3% | 1,952,220 | 5 | |
6 | 1,428,567 | 4.9% | -3.4% | 3.8% | 1,479,044 | 6 | |
7 | 1,315,826 | 4.5% | -2.8% | -5.0% | 1,353,699 | 7 | |
8 | 1,284,567 | 4.4% | -4.1% | 3.7% | 1,340,055 | 8 | |
9 | 1,173,536 | 4.0% | -3.3% | 2.1% | 1,213,697 | 9 | |
10 | 1,102,037 | 3.8% | 0.5% | 4.0% | 1,096,449 | 10 | |
11 | 736,708 | 2.5% | -12.6% | 5.2% | 842,785 | 11 | |
12 | 524,695 | 1.8% | 0.9% | 5.9% | 520,203 | 13 | |
13 | 499,130 | 1.7% | -9.9% | -5.6% | 554,130 | 12 | |
14 | 388,749 | 1.3% | -16.6% | 8.2% | 466,260 | 14 | |
15 | 316,153 | 1.1% | -16.0% | -0.9% | 376,268 | 15 | |
16 | 295,740 | 1.0% | -0.7% | 1.6% | 297,842 | 16 | |
17 | 251,363 | 0.9% | 11.7% | 15.4% | 225,112 | 18 | |
18 | 236,545 | 0.8% | -10.1% | 1.2% | 263,232 | 17 | |
19 | 205,263 | 0.7% | -1.0% | 2.6% | 207,280 | 19 | |
20 | 164,553 | 0.6% | -2.4% | -2.2% | 168,596 | 20 | |
21 | 139,458 | 0.5% | -8.4% | -0.4% | 152,265 | 21 | |
22 | 131,380 | 0.4% | -2.5% | 0.4% | 134,704 | 22 | |
23 | Chester, PA | 124,578 | 0.4% | 11.1% | 13.5% | 112,134 | 23 |
24 | 89,902 | 0.3% | 42.8% | 12.3% | 62,938 | 26 | |
25 | 86,089 | 0.3% | -8.6% | 3.8% | 94,206 | 24 | |
26 | 76,358 | 0.3% | 22.2% | 20.3% | 62,498 | 27 | |
27 | 74,085 | 0.3% | 2.8% | -5.1% | 72,087 | 25 | |
28 | 52,885 | 0.2% | 31.9% | 16.7% | 40,085 | NA | |
29 | 50,895 | 0.2% | -4.4% | 1.1% | 53,258 | 28 | |
30 | 32,415 | 0.1% | 7.0% | -4.1% | 30,299 | 29 | |
Source: Panjiva | |||||||
Race to the top
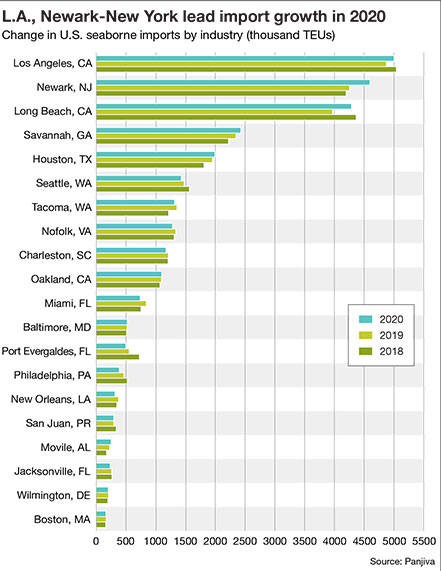 Researchers observe that the Top 30 ports also experienced the fastest growth, potentially reflecting conservative attitudes towards route management later in the year. Panjiva’s data shows that not only did imports to Newark/New York and Long Beach climb, but Los Angles expanded by just 2.6%, perhaps reflecting a higher degree of congestion later in the year.
“The historically more successful East Coast ports continued to outperform, with Savannah increasing last year and by 7.3% over the past five years following extensive investments including expanding inland port operations,” says Rogers. Houston expanded by 2.2% despite significant storm challenges during the year. Houston may also have attracted traffic away from other regional ports, as indicated by the 2020 date from New Orleans and Jacksonville.
As 2021 begins, there are a few signs that much has changed. U.S. seaborne imports climbed 13.9% year-over-year in the first half of this year, including a 31.6% surge in consumer staples products and a 24.1% rise in consumer discretionary.
“However, port congestion remains a challenge, as leading liners, including CMA CGM, shift their services to alternative ports with the lunar new year holiday break potentially not being as deep as normal as Chinese factories remained open,” adds Rogers. “Continued elevated shipping rates provide a sign that the tight supply-demand balance may be set to continue.”
Suez factor
Johnathan Foster, a principal with strategic procurement consultancy Proxima, notes that the blockage of the Suez Canal in March will also have an impact on U.S. ports—particularly on the East Coast.
“This could be one of the most disruptive produce seasons the Southeast has experienced,” says Foster. “The season usually falls between mid-March to mid-June, with about a three-month influx of distribution. During this period, produce such as watermelons and tomatoes are transported from hubs, but this influx doesn’t even consider the added capacity pressure from the transloaded ocean volumes of Charleston, Jacksonville and Savannah.”
The major point of complication is that these ports are already experiencing historic levels of congestion, adds Foster. With inbound containers coming in, there are some parallels to the retail season in West Coast.
“These goods are bound to a finite season, which creates an urgency to get the product outbound,” says Foster. “This can result in elevated rates within the transportation of goods, ultimately impacting the price of the produce at the grocery store and hitting the wallets of the end-consumer.”
Mark Segner, vice president of Datamyne Descartes, an import/export trade database company, believes that there could have been an unexpected mini-surge in East Coast exports of cargo heading to the continent due to this situation. “This would mean that some global companies could source European supply chains by moving a certain amount of inventory in North America to help facilities in Europe,” he says.
Infrastructure issues
With the prospect of new investment in ports, industry analysts are now speculating on which ocean cargo gateways are most likely to gain the lion’s share. Segner hopes that supporting alternative methods of carriage to secondary ports and better land management will be part of the mix.
“Relieving pressure on the port itself involves the land management aspect,” says Segner. “The Top 30 U.S. ports may need to look more closely at how Asian and European ports move more cargo through less acreage, exhibit less dwell time on the containers, and post faster movement to inland depots.”
According to Segner, getting the cargo off the pier and into the hinterlands seems to be a major challenge. He says he would like to see more ports earmarked to build intermodal yards capable of dispatching trains to the Midwest within hours of the cargo being discharged. “Actions like this—perhaps linked with meaningful barge services on the rivers—could be money well spent, moving cargo and relieving pressure on the roads and rails,” he says.
According to Hannah Kain, president and CEO of a global supply chain management services company ALOM, global logistics managers have been warned for years that our port infrastructure is too fragile. “Operational professionals know that when the volume is increasing over a trend line, it’s a bad sign when you max out on capacity during busy times,” she says.
And, says Kain, that’s exactly what happened in prior years when U.S. ports were unable to handle past holiday imports. However, she says that with some optimism and lots of funding, shippers can get the port restrictions solved by 2031.
“As supply chain is surfacing in politics, U.S. exporters could be helped by improved labor relations in the ports and increasing port outbound capacity and loading, preventing vessels from leaving empty while export goods are left behind,” adds Kain. “It’s frankly also a no-brainer to run ports 24/7, just like the rest of the supply chain. Smart technology for ports or other chokepoints would prevent some of the stop-and-go issues.”

Article Topics
Ports News & Resources
November Edge Report: What’s shaping freight now Turning Border Challenges into Advantages October U.S.-bound imports fall, with further declines expected in the coming months, reports S&P Global Market Intelligence Descartes report points to flattish U.S.-bound imports in October Port Tracker points to seasonal patterns for U.S.-bound volumes to end 2025 Supreme Court to hear expedited review on legality of White House IEEPA tariffs this week Trump and Xi reach preliminary trade understandings as tariff and export disputes ease More PortsLatest in Logistics
Union Pacific–Norfolk Southern merger filing with the STB is delayed delayed until mid-December Old Dominion Freight Line issues November operating metrics update Services economy remains on growth track in November, reports ISM Looking at the LTL market with Scooter Sayers U.S. Department of Transportation targets ‘CDL Mills’ as thousands of training providers removed from federal registry Key Ocean, Air, and Trade Trends as We Approach the New Year National diesel average falls 7.3 cents, down for second consecutive week, reports EIA More LogisticsAbout the Author
Subscribe to Logistics Management Magazine

Find out what the world's most innovative companies are doing to improve productivity in their plants and distribution centers.
Start your FREE subscription today.
November 2025 Logistics Management

Latest Resources


