Quest for Quality 2022: North American Ports
Infrastructure vital to service success.
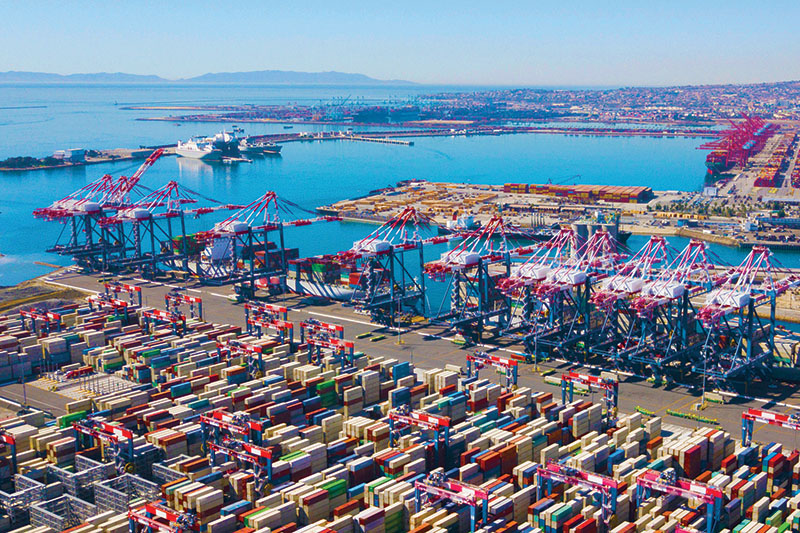

Much like every node on the global supply chain, the North American container seaport sector endured a series of disruptions caused by the pandemic—but it still ended up handling more containers than ever over the course of the past two years.
In fact, U.S.-bound retail container import volumes saw strong spring numbers. For May, the most recent month for which data is available, import volume increased 6% compared to April, and was up 2.7% annually.
What’s more, this tally represents a new monthly import record, going back to when the National Retail Federation (NRF) initially began tracking imports, coming in ahead of the previous record set in March.
And as retailers work to meet ongoing strong demand levels and hedge against potential West Coast port labor disruptions, the NRF doesn’t see volumes slipping any time soon—a period that will be sure to test the limits of the North American port infrastructure.
According to Jonathan Gold, vice president for supply chain and Customs policy at NRF: “Cargo volume is expected to remain high as we head into the peak shipping season, and it’s essential that all ports continue to operate with minimal disruption. Supply chain challenges will continue throughout the remainder of the year, and it’s particularly important that labor and management at West Coast ports remain at the bargaining table and reach an agreement.”
No matter what curve balls are thrown to them next, our readers tell us that it can be sure that the 14 ports taking home Quest for Quality gold in 2022 will be equal to the task. While all the overall weighted scores of the winners were notable across the board, it’s worth noting that the Port of San Diego put up the highest overall score in the category (54.35), with top marks across all the attribute categories out west.
Northeast Ports (Bold indicates leader in attribute category)
| Ease of doing business |
Value | Ocean Carrier network |
Intermodal network |
Equipment & operations |
Weighted score |
|
| Massport | 10.85 | 9.71 | 8.45 | 7.93 | 10.06 | 46.99 |
| Port Authority of NY & NJ | 8.24 | 9.63 | 9.24 | 8.86 | 9.53 | 45.50 |
| AVERAGE | 8.85 | 9.52 | 9.14 | 8.54 | 9.40 | 45.45 |
Source: Logistics Management, Peerless Research Group (PRG)
Mid Atlantic Ports (Bold indicates leader in attribute category)
| Ease of doing business |
Value | Ocean Carrier network |
Intermodal network |
Equipment & operations |
Weighted score |
|
| PhilaPort (The Port of Philadelphia) | 10.55 | 9.71 | 9.10 | 8.54 | 10.06 | 47.95 |
| Port of Baltimore | 10.32 | 9.88 | 8.29 | 6.86 | 9.70 | 45.04 |
| AVERAGE | 10.63 | 9.31 | 8.17 | 6.97 | 9.44 | 44.52 |
Source: Logistics Management, Peerless Research Group (PRG)
Southern Ports (Bold indicates leader in attribute category)
| Ease of doing business |
Value | Ocean Carrier network |
Intermodal network |
Equipment & operations |
Weighted score |
|
| Jacksonville Port Authority | 11.39 | 11.56 | 8.67 | 6.86 | 11.01 | 49.49 |
| Port of Savannah | 10.90 | 10.59 | 9.57 | 8.42 | 9.48 | 48.96 |
| Port of San Juan | 12.66 | 10.40 | 7.80 | 7.32 | 10.78 | 48.96 |
| AVERAGE | 10.85 | 10.26 | 8.90 | 7.32 | 9.44 | 46.78 |
Source: Logistics Management, Peerless Research Group (PRG)
Gulf Ports (Bold indicates leader in attribute category)
| Ease of doing business |
Value | Ocean Carrier network |
Intermodal network |
Equipment & operations |
Weighted score |
|
| Port of Houston | 10.34 | 10.07 | 10.06 | 7.52 | 10.21 | 48.20 |
| AVERAGE | 10.65 | 9.58 | 9.51 | 7.66 | 9.80 | 47.19 |
Source: Logistics Management, Peerless Research Group (PRG)
Great Lakes Region Ports (Bold indicates leader in attribute category)
| Ease of doing business |
Value | Ocean Carrier network |
Intermodal network |
Equipment & operations |
Weighted score |
|
| Port of Montreal | 9.04 | 9.15 | 10.14 | 8.05 | 11.21 | 47.59 |
| AVERAGE | 10.22 | 8.32 | 9.22 | 6.99 | 9.80 | 44.54 |
Source: Logistics Management, Peerless Research Group (PRG)
West Coast Ports (Bold indicates leader in attribute category)
| Ease of doing business |
Value | Ocean Carrier network |
Intermodal network |
Equipment & operations |
Weighted score |
|
| Port of San Diego | 11.61 | 11.09 | 10.40 | 9.76 | 11.49 | 54.35 |
| Port of Vancouver, Canada | 9.65 | 10.05 | 9.93 | 8.85 | 10.06 | 48.53 |
| Port of San Francisco | 10.13 | 9.36 | 8.78 | 8.24 | 10.78 | 47.27 |
| Port of Portland | 9.65 | 9.15 | 7.80 | 8.05 | 9.48 | 44.13 |
| Port of Oakland | 8.74 | 8.32 | 9.43 | 7.63 | 8.62 | 42.73 |
| AVERAGE | 8.09 | 8.03 | 9.35 | 7.58 | 8.20 | 41.25 |
Source: Logistics Management, Peerless Research Group (PRG)
2022 Quest for Quality Winners Categories

Article Topics
Ports News & Resources
PwC report indicates transportation and logistics dealmaking activity is focused on strategy, not scale Tariffs continue to cast a long shadow over freight markets heading into 2026 U.S.-bound imports see November declines, reports S&P Global Market Intelligence U.S.-bound imports slide in November as seasonal slowdowns and tariff uncertainty weigh on volumes Port Tracker report points to ongoing import declines as 2025 ends and into 2026 Port of Long Beach appoints Hacebaga as its next CEO, effective January 1 Logistics growth sees mild decline in November, states LMI More PortsLatest in Logistics
Union Pacific-Norfolk Southern merger application is filed with the Surface Transportation Board FedEx posts fiscal first quarter earnings growth U.S. rail carload and intermodal volumes are down, for week ending December 15, reports AAR DAT’s November Truckload Volume Index sees more mixed results November intermodal volumes see annual decline, reports IANA Looking at the state of the parcel market with Robert Persuit, Sr. Director of Business Development, ShipMatrix Teamsters Rail Conference makes its case for the Union Pacific-Norfolk Southern proposed merger to not be approved by the STB More LogisticsSubscribe to Logistics Management Magazine

Find out what the world's most innovative companies are doing to improve productivity in their plants and distribution centers.
Start your FREE subscription today.
December 2025 Logistics Management

Latest Resources


